
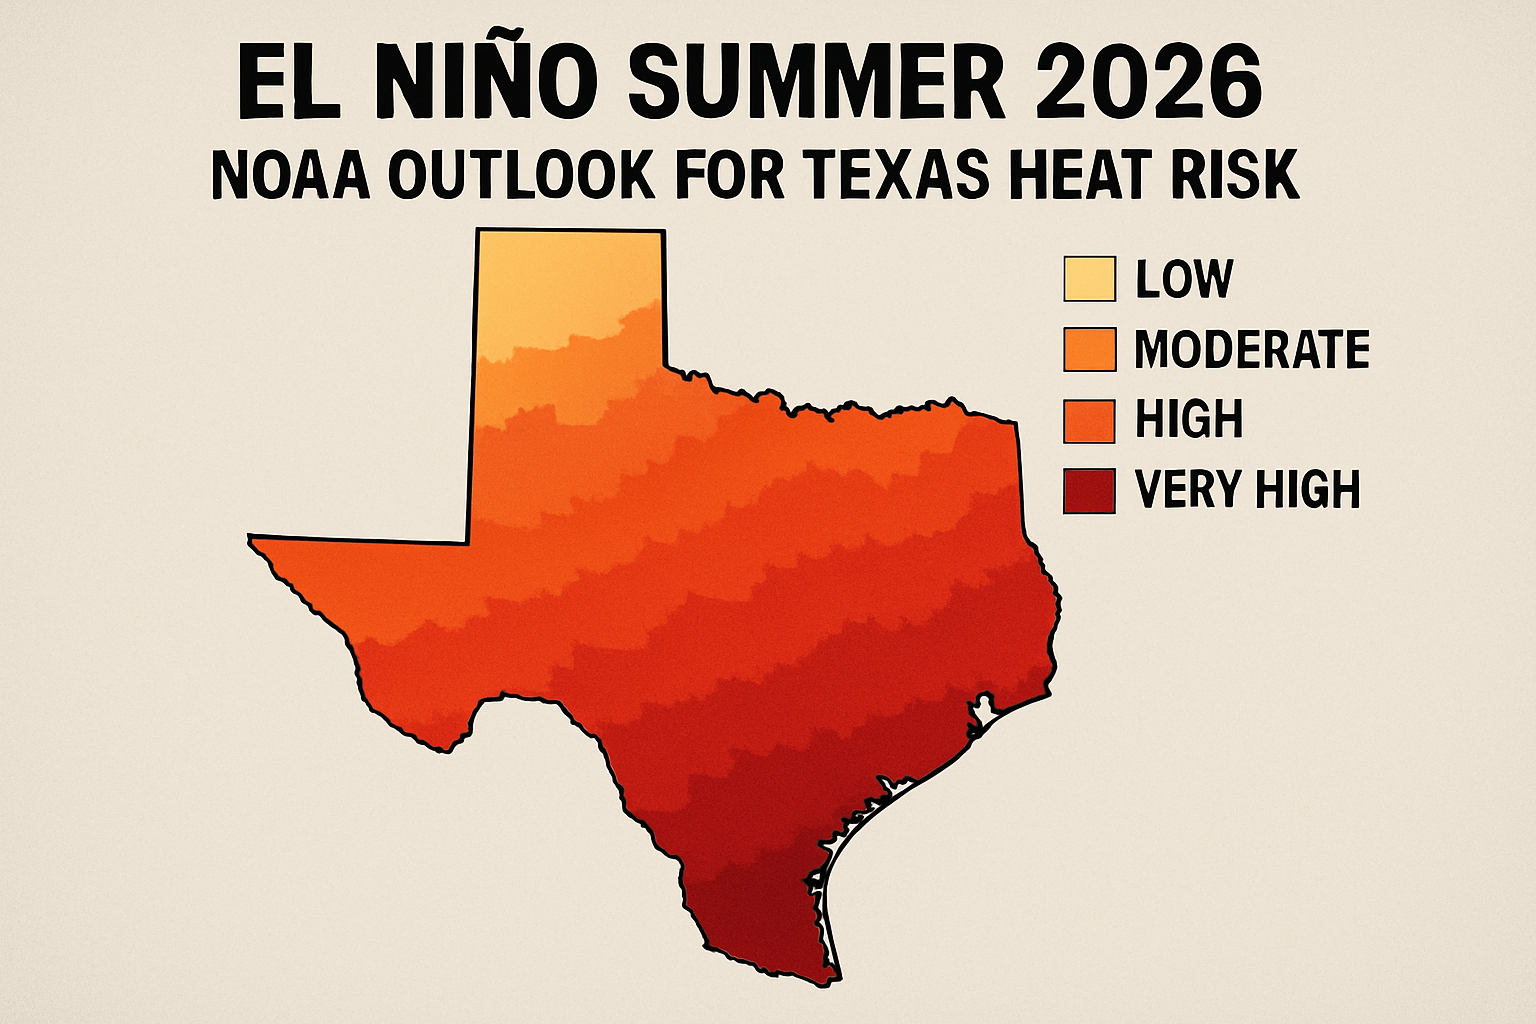
El Niño Summer 2026: NOAA Outlook for Texas Heat Risk
Why Texas viewers should care about the 2026 outlook package
Seasonal climate outlooks do not tell you whether July 15 will hit 105°F in Dallas or whether Houston will break a humidity record. What they do provide—when produced through federal operational centers—is a structured statement about likelihoods for broad patterns over months-long windows. As households across Texas budget for cooling costs and grid planners watch for sustained heat, the spring 2026 discussion from NOAA’s Climate Prediction Center is explicitly tracking a transition toward El Niño during the May–June–July window, with implications that stretch from soil moisture west of Interstate 35 to muggy Gulf mornings along the coast (¹). Those outlooks are issued before their validity periods begin; CPC states that within any outlook period, observations plus short- and medium-range forecasts should be consulted rather than relying on the seasonal package alone (¹).
ENSO in plain terms
El Niño is shorthand for the warm phase of the El Niño/Southern Oscillation cycle—often abbreviated ENSO—which couples shifts in tropical Pacific sea-surface temperatures with broader atmospheric circulation patterns (²). During neutral phases, ocean and atmosphere behavior sits closer to historical averages; during warm events, coupled interactions can reorganize rainfall and jet-stream placement across North America. CPC’s April 2026 summary states that observations showed the transition from La Niña to ENSO-neutral had completed, with El Niño forecast to emerge during May–June–July with a 61 percent chance and to persist through at least the end of 2026 (¹). The same discussion tracks subsurface warmth spanning much of the equatorial Pacific and notes that consolidated Niño-3.4 projections climb past El Niño thresholds around late spring, peak later in 2026 in consolidation guidance, and carry widening error bars by autumn—partly reflecting differences among dynamical models about how strong the warm event could become (¹).
Seasonal normals and the 1991–2020 baseline
CPC reminds readers that the probability language on seasonal maps rests on 1991–2020 climatic normals—the reference period tied to World Meteorological Organization guidance to use the most recent three complete decades—and that anomaly calculations framed against those newer normals track shorter-term departures more faithfully than products pegged to older baselines (¹).
How CPC expresses uncertainty on seasonal maps
Official seasonal outlook products rely on probability shifts among three categories—below-, near-, and above-normal—rather than pinning down a single deterministic outcome. Where forecast tools cannot distinguish among categories with confidence, CPC labels areas as equal chances, meaning “the probability of the most likely category cannot be identified” relative to climatological odds (²). CPC’s tools documentation stresses that precipitation forecasts from consolidated systems are generally less skillful than temperature forecasts—sometimes only marginal skill even at peak seasons—while temperature guidance tends to carry comparatively stronger skill signatures (³). Interpreting a dry tilt over the Plains therefore requires more caution than interpreting a broad warm anomaly over the interior West.
Forecasts are expressed as the probabilities that seasonal mean temperature or total precipitation lands in the most likely of three classes—above, near, or below normal—with class limits dividing the 1991–2020 climatological distribution into thirds so each class begins from a 33.3 percent climatological baseline (³). CPC walks through how probability anomalies shift mass among those categories for simplified conversions—examples included for 20%, 30%, and 40% positive anomalies—and reminds readers that the crude arithmetic loses accuracy when anomalies grow large (³).
What the April 2026 outlook emphasizes for temperature
For May–June–July 2026, CPC’s forecaster discussion favors above-normal seasonal mean temperatures across much of the contiguous United States, with the highest stated probabilities—roughly 60–70 percent—in parts of the northern and central Great Basin and Rockies; portions of the northern Plains eastward through the Upper Mississippi Valley and Great Lakes sit in equal-chances territory instead (¹). Over the interior Southeast, the outlook depicts a secondary maximum for above-normal temperatures in roughly the 50–60 percent range, linked in part to very dry soil profiles already in place (¹).
Looking ahead through the heart of summer, the same write-up stresses that during June–August, July–September, and August–October, the signal for anomalous warmth remains dominant across much of the country, “especially over the western half of the Lower 48 states, Gulf Coast states, and East Coast states,” with the greatest above-normal temperature chances highlighted over the West and Northeast (¹). For Texas readers, “Gulf Coast states” language matters because it explicitly places the humid eastern tier of the state inside the cluster where warm-season outlooks lean warmer than the 1991–2020 baseline—not a day-by-day forecast, but a seasonal tilt anchored on operational normals (¹). CPC also explains that with El Niño expected to mature after summer begins, some circulation responses historically associated with cool anomalies during summer can appear in regression-based guidance—example: slightly favored below-normal temperatures by July–September and August–October across parts of the middle Mississippi Valley into the central Great Lakes—showing why El Niño is not a universal southern furnace switch (¹).
Forecasters explicitly flag the spring predictability barrier—the stretch when tropical Pacific sea-surface temperature forecasts are less reliable—and note that El Niño composites for United States impacts become more dependable once outlooks advance toward July–September and beyond (¹). By autumn, CPC describes outlook maps beginning to resemble familiar El Niño composites across the southern tier even as northern areas retain warmth in the consolidated guidance (¹).
Precipitation shading and drought-adjacent heat stress west of the humid belt
Summer heat risk is not only about thermometer readings; it also interacts with soil moisture and evaporative demand. CPC’s April outlook ties widespread anomalous warmth over the West to antecedent snowpack deficits, dry soils, and analog techniques anchored on Pacific sea-surface temperatures (¹). For precipitation, May–June–July emphasizes modestly enhanced odds of above-normal seasonal totals along much of the Atlantic Coast extending into the eastern Gulf Coast region, while relative dryness is favored from parts of the Pacific Northwest southeastward across portions of the central Great Plains (¹). Moving into June–August and July–September, below-normal precipitation is favored across parts of the central and southern Plains—regions that overlap north and west Texas—alongside continuing drought considerations called out in CPC’s narrative (¹). By August–October, consolidated tools continue to favor dryness across portions of the Northwest and Plains while monsoon signals support wetter odds over parts of the Desert Southwest (¹).
That juxtaposition matters on the ground: Gulf moisture can keep heat indices elevated along the coast even when seasonal rainfall outlooks lean wetter, while drier soil profiles inland can amplify daytime temperatures during cloud-free stretches—precisely where CPC already expects drought pressures to linger in its storyline (¹). CPC additionally notes tropical-cyclone considerations late in summer: stronger upper-level winds over parts of the western Atlantic and Caribbean during El Niño can disrupt storm activity, influencing how precipitation outlooks are placed inland along the Southeast coast (¹).
Cities, asphalt, and layered heat stress
Federal outlooks describe regional probability envelopes; local exposure still turns on urban form. The U.S. Environmental Protection Agency explains that heat islands—built environments that retain heat—can raise urban temperatures relative to outlying areas, which influences comfort and peak cooling demand at the neighborhood scale (⁴). CPC’s seasonal outlook documentation separately notes that regression tools designed for station- or division-scale forecasts may capture localized departures driven by terrain, adjacent water bodies, or developing urban heat islands—precisely the kind of micro-scale variability statewide grids smooth over (³). Layer Gulf Coast warmth odds from the long-lead discussion with neighborhood land cover and you get a realistic picture of why “Texas heat risk” is not one story but many microclimates inside the same seasonal envelope.
Electricity demand context for warm summers
When seasonal outlooks lean warm across the South, air conditioning becomes the bridge between weather probabilities and household bills. The U.S. Energy Information Administration notes that homes in the South consume more electricity on average than other regions, reflecting warmer climates and heavier air-conditioning use; nationally, about 89 percent of homes used air conditioning as of 2020, compared with 57 percent in 1980, with central systems installed in roughly two-thirds of homes (⁵). Average household electricity consumption sits near 10,500 kilowatthours per year with wide regional variation—another reminder that statewide narratives still collapse into unit-specific cooling behavior (⁵).
Takeaways for electricity shoppers and energy readers
NOAA’s operational outlooks are planning aids, not deterministic heat warnings. They align poorly with “pick the hottest day” betting but align well with questions like whether summer 2026 is likely to carry an El Niño-modulated background state favoring anomalous warmth along the Gulf Coast and competing dryness signals farther west across the Plains (¹). CPC itself stresses reviewing evolving observations inside each outlook window—a discipline that matters for anyone translating seasonal odds into hedging or procurement conversations (¹). For readers comparing competitive supply offers, the practical hinge often sits in contract structure and usage patterns rather than headline rates alone (⁶). Seasonal outlooks do not replace daily forecasts—but they help frame why probability, not certainty, is the right lens for Texas heat risk heading into El Niño’s expected onset.